1.Run single cell flux estimation analysis via the scFEA-webserver
Users can start the analysis by clicking the “Run scFEA” tab on top of main webpage of the server.
Step 1: Select the species where the transcriptomics is collected from and specify the interested metabolic networks
Users need to select species and metabolic network from the boxes on the left side of the webpage. The current version of scFEA-webserver includes two central metabolic maps, named M171 and KEGG, (two almost completed metabolic maps) and 13 specific metabolic sub-networks of human and mouse, and a genome-wide metabolic map reconstructed by KEGG metabolic modules for 13 other experimental species, as detailed below:
| Network Name |
Network Description |
| M171 |
An almost complete metabolic map |
| M171_NAD |
An M171_NAD central metabolic network |
| KEGG |
An almost complete genome-wide metabolic map reconstructed from KEGG metabolic modules |
| GGSL |
Central metabolism network and its branches of glucose and glutamine metabolism in subcellular localization resolution |
| Glucose-TCAcycle |
Glycolysis, pentose phosphate and TCA cycle pathways |
| Glucose-Glutaminolysis |
Glycolysis, TCA cycle, and glutaminolysis pathways |
| Glucose-Glutamine |
General glucose and glutamine metabolic pathways |
| BCAA |
Branched chain amino acids metabolic pathways |
| Acetylcholine |
Acetylcholine biosynthesis and metabolism |
| Dopamine |
Dopamine biosynthesis and metabolism |
| Histamine |
Histamine biosynthesis and metabolism |
| Serotonin |
Serotonin biosynthesis and metabolism |
| IronIon |
Sub-cellular specific metabolic network of iron ion |
| MGF |
The Methionine Glutathione Folic Acid (MGF) metabolic network |
| Lipid Metabolism |
The Methionine Glutathione Folic Acid (MGF) metabolic network |
| MHC-I |
MHC Class I Antigen Presentation (MHC-I) network |
| Species |
KEGG Organism Code |
| Homo Sapiens |
hsa |
| Mus musculus |
mmu |
| Ciona robusta |
cin |
| Zea mays |
zma |
| Danio rerio |
dre |
| Gallus gallus |
gga |
| Xenopus tropicalis |
xtr |
| Rattus norvegicus |
rno |
| Escherichia coli K-12 |
eco |
| Bacillus subtilis subsp. subtilis str. 168 |
bsu |
| Pseudomonas fluorescens SBW25 |
pfs |
| Arabidopsis thaliana |
ath |
| Azotobacter vinelandii DJ |
avn |
| Synechocystis sp. PCC 6803 |
syn |
| Methanococcus voltae A3 |
mvo |
| Streptomyces coelicolor A3(2) |
sco |
| Methanosarcina acetivorans C2A |
mac |
Users can see detailed description and visualization of each selected network when a network is selected.
Step 2: Upload data
Users will further upload the input data to the webserver. The input of scFEA is an scRNA-seq or general transcriptomics data, in which each row is one gene, and each column is one sample. TPM (or CPM/FPKM) normalized data is recommended. scFEA webserver accepts comma-(.csv), space-(.txt), tab-(.txt) delimited input files. Please make sure the input data is in a matrix format and contains row/column names. Both gene symbol and Ensembl gene ID of human and mouse are accepted. The maximal input file size is 500MB. For a large data set, we recommend users upload only the gene expression data of the scFEA metabolic genes, as other genes will not be considered in the flux estimation. The scFEA human genes and scFEA mouse genes can be downloaded here or from the Download page. The graph neural network based formulation of scFEA allows for the flexibility that expression values of some metabolic genes are missing from the input data.
Step 3: Parameters
Users need to specify two hyperparameters.
(1) If the data is sparse, an imputation procedure is recommended. The default imputation method is MAGIC (Van Dijk et al. Cell 2018).
(2) Four normalization options are provided, namely, (i) no normalization, (ii) log transformation, namely log(x+1), where x represents the original input matrix x, (iii) CPM normalization, and (iv) log transformation of CPM normalized values, namely, log(CPM+1).
Submit task:
Users can then click the Submit Task button to submit the job.
A unique job ID is assigned to each submission, such as “0620f1d4-1a70-4cb3-b249-f6bed67a00cf”. Progress and results can be accessed by using the job ID.
2.Check results and download
Check analysis progress:
By clicking the “Results” tab, users can access their jobs, which could be still under running or finished.
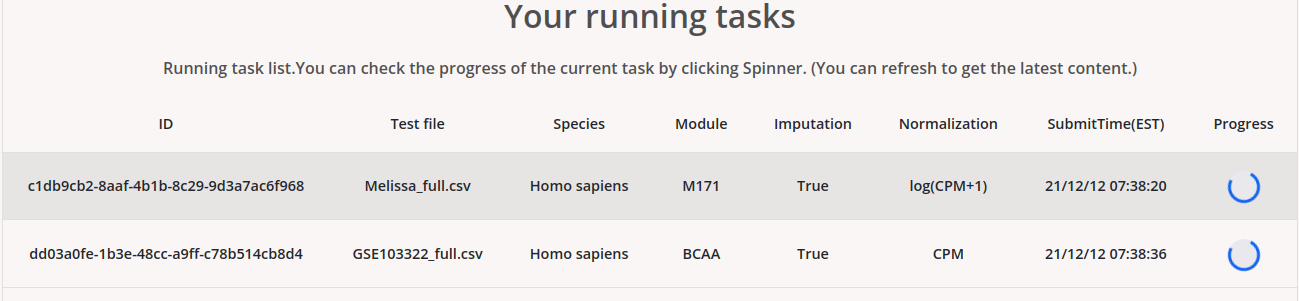

Users can click the progress icon to check the percentage of progress of the analysis. Users can also set an email to get notified when the job is finished.
Check results:
If a job is finished, users will see the job information as:
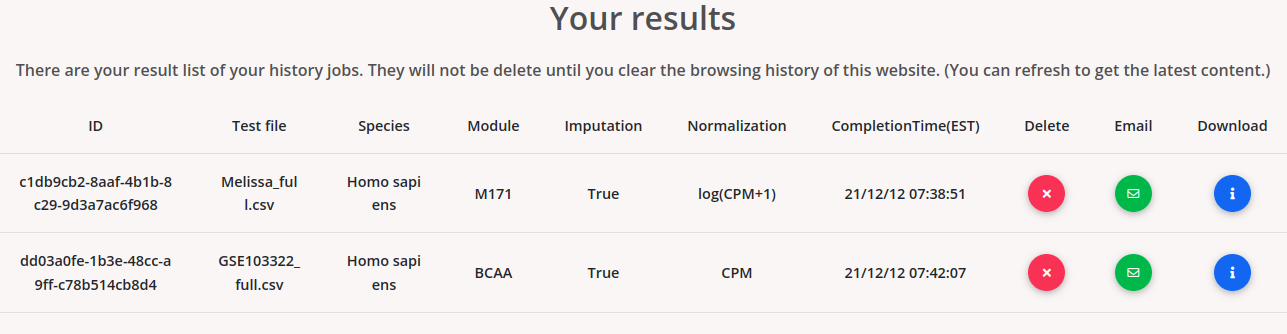
The results are temporarily memorized by using a cookie mechanism. The submitted jobs will be memorized on the same browser after the submission until you clear it. Users can download the results by clicking “download”. Users can also email the results via the email option. Users can delete their job from the cookie memory by clicking “delete”.
Downloadable results:
For each job, scFEA-server offers five downloadable results, as illustrated below:
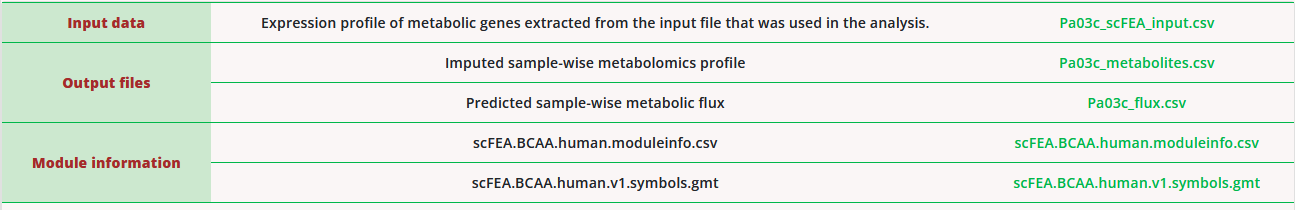
- The input data of the flux estimation algorithm. Only scFEA metabolic genes were utilized by the flux estimator. The metabolic genes not included in the input data will be considered as having 0 expressions.
- The output of predicted sample-wise metabolic flux, in which each row is a module, each column is a sample, and each entry is a predicted flux rate.
- The output of imputed sample-wise metabolomics profile, in which each row is a metabolite, each column is a sample, and each entry is an imputed metabolomics change of metabolite.
- Module information of the selected metabolic network.
- Gene information of the selected metabolic network.
Downloadable resources
We provide the following resources/results for direct downloading:
- Seven example input data sets of different format.
- The module information of the 18 predefined metabolic networks/subnetworks in human and mouse (.csv files), and genes of each module in each metabolic network (.gmt files). Noted, each module includes closely related reactions, and is manually collected and reconstructed to form more meaningful metabolic units than existing curated metabolic pathways. The .gmt file is of the same format of the gene sets provided by the MsigDB, which could be directly applied for a pathway enrichment analysis.
- Results computed from commonly analyzed datasets such as TCGA, GTEx and CCLE data.
- Results computed from high quality scRNA-seq/snRNA-seq data.
Browser compatibility
| OS |
Version |
Chrome |
Firefox |
Microsoft Edge |
Safari |
| Linux |
Ubuntu 20 |
95 |
93 |
n/a |
n/a |
| MacOS |
High Sierra |
95 |
93 |
n/a |
15 |
| Windows |
10 |
95 |
93 |
95 |
n/a |